Model review

Dell XPS 13 9360 review

Dell XPS 13 9360 — from 2016, 1.22 kg, performance 33.
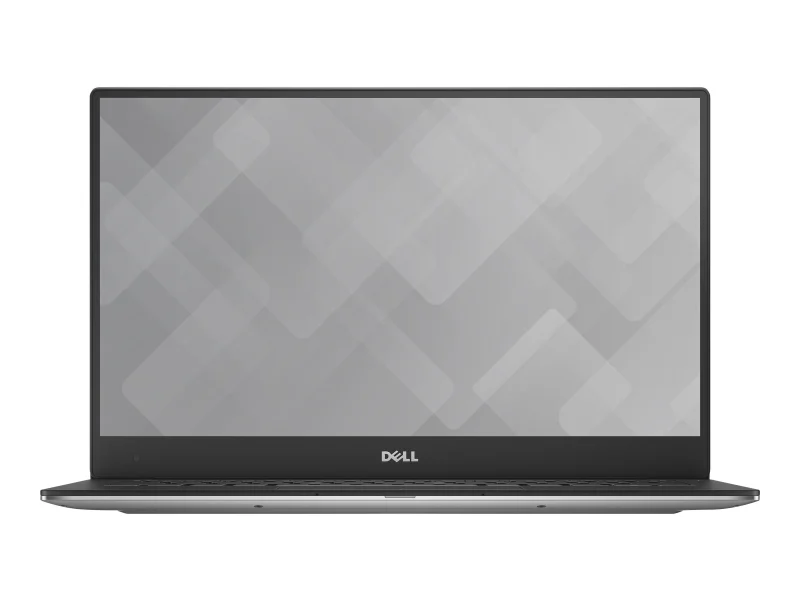
Dell XPS 13 9360

Technical specifications

Type Ultrabook
Release year 2016
Screen 13.3" · 1920x1080
Processor Intel Core i7 8550U , Intel Core i5 7200U , Intel Core i5 7300U , Intel Core i7 7500U , Intel Core i5 8250U , Intel Core i7 7560U , Intel Core i7 7660U , Intel Core i3 7100U
Max. RAM 32 GB
Weight 1.22 kg
Battery 60 Wh

Performance scores

Perf.
33
/100
CPU
41
/100
GPU
12
/100
USComp
42
/100

Where the XPS 13 9360 stands

The Dell XPS 13 9360 is a 2016 premium ultrabook — one of the most iconic thin-and-light designs of its era. At roughly $1,087, it sits well above the ultrabook-category median of $373, reflecting the XPS brand premium and the enduring desirability of the form factor. The GPU score of 12.4 is above the category average, offering modest graphics headroom. The weakness is reliability: a score of 17 is 67% below the category median, which is a significant concern for a ten-year-old machine at this price. The value proposition depends heavily on whether the buyer values the XPS design and build enough to justify the premium.

A modest graphics edge in a premium chassis

The XPS 13 9360's GPU score of 12.4 is 224% above the ultrabook-class median of 3.8, placing it in the office graphics tier. This is enough for smooth media playback, light photo editing, and older games at minimum settings (Overwatch, Grand Theft Auto V, and Rainbow Six Siege are within reach). Visual Studio Code runs without issue. The graphics advantage is modest rather than transformative — this is not a gaming ultrabook — but it does give the 9360 more versatility than typical integrated-only competitors.

The reliability question at a premium price

The primary concern is value relative to condition. A reliability score of 17 is 67% below the ultrabook-class median of 51. For a ten-year-old machine priced at $1,087, this means the buyer is paying a significant premium for a device with below-average durability. The XPS 13's superb build quality, iconic infinity-edge display, and compact form factor are real assets, but buyers should carefully weigh whether the design premium justifies the reliability risk at this price level. More modern ultrabooks with better reliability scores are available for less.

Price trajectory

The XPS 13 9360 has depreciated at roughly 7.2% per year from an estimated $1,400 launch price to today's $1,087. The projected price two years out is approximately $936, a further 14% decline. The slow depreciation rate reflects the XPS brand's value retention, but the machine will continue losing value as newer, more capable ultrabooks enter the refurbished market.

How it compares

No direct alternatives appear in the immediate comparison set at this price level. Within the ultrabook category, the XPS 13 9360 competes on brand and design rather than on raw value — at $1,087, buyers can find newer, more reliable ultrabooks with better performance specifications. The 9360's appeal is specific to buyers who value the XPS design language, the infinity-edge display, and the iconic form factor enough to accept the reliability compromise and the premium price.

Bottom line

The XPS 13 9360 is fairly priced for its class, but the value proposition is narrow. At $1,087, it offers a premium design, a modest graphics edge, and the enduring appeal of the XPS brand. The reliability score of 17 — 67% below the category median — is the honest caveat, and at this price level, buyers should carefully consider whether newer, more reliable ultrabooks represent better value. For enthusiasts who specifically want the 9360 for its design and form factor, the price reflects market demand. For buyers seeking the best value in a thin-and-light ultrabook, there are more practical options.

🧭 Your context

Stage: Vague sense of need

Browse category overviews to narrow things down.

🎮 What it can run

⚙️ Configuration analysis

Top configuration: Intel Core i7 8550U · 32GB RAM
CPU: Intel Core i7 8550U · 8th RAM: 32 GB
office tier

Top configuration is built for office apps, web browsing, and basic daily tasks.

🤔 How to choose

Universal advice for any use case.

  • Reliability vs price: reliability (median 51) ↔ price (median 373.2).
  • Weight vs CPU: mobility (median 64) ↔ overall performance (median 41.7).
  • Upgradeability vs battery: upgradability (median 50) ↔ battery life (median 4.4).

XPS 13 9360: verdict

+
Best for: everyday graphics and media
!
Watch out for: long-term reliability may be limited
$
Price: $1,087 — fairly priced for the class

➡️ Next step

Browse category overviews to narrow things down.

Technical reference for Dell XPS 13 9360.

Full specifications

Brand
Dell
Series
XPS 13/14/15/16/17
Type
Ultrabook
Release year
2016
Screen size
13.3"
Resolution
1920x1080
Panel type
IPS
Color gamut (sRGB)
100%~
RAM (max)
32 GB DDR4
Weight
1.22 kg
Ports
4
Backlit keyboard
Webcam
Battery
60 Wh

Performance scores

Performance
33
/100
CPU
41
/100
GPU
12
/100
USComp
32
/100

Performance metrics

Performance 33
Portability 83
Light office 48
Gaming 63
Creative 17
Energy efficiency 71
Connectivity 60
Value 12
Color accuracy
🎮

No FPS data for this model's GPU.

The GPU may be integrated or not yet benchmarked.

💻 Software compatibility

Counter-Strike 2 ✗ Weak
CPU
82%
GPU
18%
RAM
400%
Grand Theft Auto V ✓ Runs well
CPU
204%
GPU
249%
RAM
800%
Cyberpunk 2077 ✗ Weak
CPU
117%
GPU
41%
RAM
400%
Minecraft ✓ Runs well
CPU
408%
GPU
124%
RAM
800%
Fortnite ✗ Weak
CPU
74%
GPU
78%
RAM
400%
Valorant ✓ Runs well
CPU
272%
GPU
249%
RAM
800%
The Witcher 3: Wild Hunt ✗ Weak
CPU
136%
GPU
50%
RAM
533%
Elden Ring ✗ Weak
CPU
74%
GPU
26%
RAM
267%
Red Dead Redemption 2 ✗ Weak
CPU
136%
GPU
44%
RAM
400%
Apex Legends ✗ Weak
CPU
74%
GPU
31%
RAM
533%
Hogwarts Legacy ✗ Weak
CPU
91%
GPU
41%
RAM
200%
Dota 2 ✓ Runs well
CPU
272%
GPU
249%
RAM
800%
Baldur's Gate 3 ✗ Weak
CPU
74%
GPU
36%
RAM
400%
Starfield ✗ Weak
CPU
58%
GPU
18%
RAM
200%
Call of Duty: Warzone ✗ Weak
CPU
74%
GPU
36%
RAM
400%
League of Legends ✓ Runs well
CPU
408%
GPU
249%
RAM
999%
Sims 4 ✓ Runs well
CPU
272%
GPU
249%
RAM
800%
Helldivers 2 ✗ Weak
CPU
58%
GPU
19%
RAM
400%
Battlefield 5 ✗ Weak
CPU
91%
GPU
41%
RAM
400%
Far Cry 5 ✗ Weak
CPU
102%
GPU
57%
RAM
400%
Forza Horizon 4 ✗ Weak
CPU
117%
GPU
69%
RAM
400%
Forza Horizon 5 ✗ Weak
CPU
91%
GPU
36%
RAM
400%
Metro Exodus ✗ Weak
CPU
102%
GPU
40%
RAM
400%
Overwatch ✓ Runs well
CPU
163%
GPU
249%
RAM
800%
PUBG: Battlegrounds ✗ Weak
CPU
102%
GPU
52%
RAM
400%
Resident Evil 4 Remake ✗ Weak
CPU
82%
GPU
30%
RAM
400%
Escape from Tarkov ✗ Weak
CPU
136%
GPU
50%
RAM
400%
God of War ✗ Weak
CPU
186%
GPU
52%
RAM
400%
Horizon Zero Dawn ✗ Weak
CPU
186%
GPU
41%
RAM
400%
Death Stranding ✗ Weak
CPU
163%
GPU
40%
RAM
400%
Control ✗ Weak
CPU
136%
GPU
41%
RAM
400%
Doom Eternal ✗ Weak
CPU
186%
GPU
62%
RAM
400%
Batman: Arkham Knight ✗ Weak
CPU
227%
GPU
62%
RAM
533%
Hitman 3 ✗ Weak
CPU
186%
GPU
62%
RAM
400%
Flight Simulator 2020 ✗ Weak
CPU
146%
GPU
50%
RAM
400%
Watch Dogs Legion ✗ Weak
CPU
146%
GPU
52%
RAM
400%
Borderlands 3 ✗ Weak
CPU
163%
GPU
44%
RAM
533%
Anno 1800 ✗ Weak
CPU
136%
GPU
62%
RAM
400%
Rainbow Six Siege ✓ Runs well
CPU
340%
GPU
124%
RAM
533%
The Division 2 ✗ Weak
CPU
186%
GPU
50%
RAM
400%
Gears Tactics ✗ Weak
CPU
163%
GPU
83%
RAM
400%
Hunt Showdown ✗ Weak
CPU
146%
GPU
62%
RAM
533%
Tiny Tina's Wonderlands ✗ Weak
CPU
136%
GPU
30%
RAM
400%
Mafia Definitive Edition ✗ Weak
CPU
186%
GPU
62%
RAM
533%
Days Gone ✗ Weak
CPU
186%
GPU
41%
RAM
400%
Ghostwire Tokyo ✗ Weak
CPU
97%
GPU
52%
RAM
267%
Returnal ✗ Weak
CPU
117%
GPU
31%
RAM
200%
Dying Light 2 ✗ Weak
CPU
136%
GPU
30%
RAM
400%
Resident Evil Village ✗ Weak
CPU
117%
GPU
36%
RAM
400%
The Callisto Protocol ✗ Weak
CPU
82%
GPU
31%
RAM
400%
Atomic Heart ✗ Weak
CPU
128%
GPU
52%
RAM
400%
Alan Wake 2 ✗ Weak
CPU
97%
GPU
19%
RAM
200%
Black Myth Wukong ✗ Weak
CPU
82%
GPU
52%
RAM
200%
Ghost of Tsushima ✗ Weak
CPU
82%
GPU
52%
RAM
400%
The Last of Us Part 1 ✗ Weak
CPU
82%
GPU
31%
RAM
200%
Diablo 4 ✗ Weak
CPU
186%
GPU
62%
RAM
400%
Spider-Man Miles Morales ✗ Weak
CPU
136%
GPU
62%
RAM
400%
Star Wars Jedi Survivor ✗ Weak
CPU
82%
GPU
23%
RAM
400%
Dead Space Remake ✗ Weak
CPU
128%
GPU
30%
RAM
400%
Lies of P ✗ Weak
CPU
117%
GPU
52%
RAM
400%
Sons of the Forest ✗ Weak
CPU
82%
GPU
27%
RAM
267%
Rise of the Tomb Raider ✓ Runs well
CPU
272%
GPU
124%
RAM
800%
Shadow of the Tomb Raider ✗ Weak
CPU
227%
GPU
62%
RAM
400%
Assassin's Creed Odyssey ✗ Weak
CPU
204%
GPU
62%
RAM
400%
Assassin's Creed Valhalla ✗ Weak
CPU
117%
GPU
52%
RAM
400%
F1 24 ✗ Weak
CPU
227%
GPU
30%
RAM
400%
Need for Speed Heat ✗ Weak
CPU
117%
GPU
36%
RAM
400%
Civilization 6 ✓ Runs well
CPU
272%
GPU
124%
RAM
800%
Star Wars Jedi Fallen Order ✓ Runs well
CPU
227%
GPU
104%
RAM
400%

Configuration options

Available model options · 17 variants across 6 categories

⚙ Processors (8)
Intel Core i7 (8th Gen) 8550U Intel Core i5 (7th Gen) 7200U Intel Core i5 (7th Gen) 7300U Intel Core i7 (7th Gen) 7500U Intel Core i5 (8th Gen) 8250U Intel Core i7 (7th Gen) 7560U Intel Core i7 (7th Gen) 7660U Intel Core i3 7100U
🖥 Displays (2)
1920 x 1080 (Full HD) 3200 x 1800 (QHD+)
🎮 Graphics (2)
Intel UHD Graphics 620 Intel Iris Plus Graphics 640
• Igpu (1)
Intel HD Graphics 620
🔲 Memory (2)
8 GB (provided memory is soldered) 16 GB (provided memory is soldered)
💾 Storage (2)
256 GB SSD M.2 PCIe 512 GB SSD M.2 PCIe

Similar models

Explore alternatives across different angles.